
Travel Burden to Receive Health Care
October 2022
by Per Ostmo, MPA and Jessica Rosencrans, BBA
Funded by the Federal Office of Rural Health Policy (FORHP), under the Health Resources and Services Administration (HRSA), the Rural Health Research Gateway disseminates work of the FORHP-funded Rural Health Research Centers (RHRCs) to diverse audiences. This resource provides a summary of recent research, conducted by the RHRCs, on travel burdens to receive health care.
Hospital Closures and Reduced Access to Care
Hospital closures can be defined as “complete closures,” where health care services are no longer offered, or “converted closures,” where inpatient health care services are no longer provided but other service lines remain available.1 Between 2010 and 2021, there were 136 documented rural hospital closures.1 Both types of closures negatively impact access to health care services and can increase the travel times and distances required to receive care.
Travel Burden to Receive Care Among Individuals Aged Five Years and Older
The 2017 National Household Travel Survey collected data from individuals aged five years and older and measured travel data at household, personal trip, and vehicle levels, as well as economic, demographic, geographic, and other factors that influence travel behavior.2 In 2017, about 5.5 billion trips were made in the U.S. for medical or dental care.2 Each survey respondent within a household filled a travel log and self-identified “trips” at the person-level.2 For example, a car carrying four individuals was counted as four trips. The majority of these trips were made during weekdays (92.5%) and during the work hours of 7:00 am – 4:59 pm (91.2%).2 Time and distance spent in travel for care increased with age among both rural and urban residents.2
Time
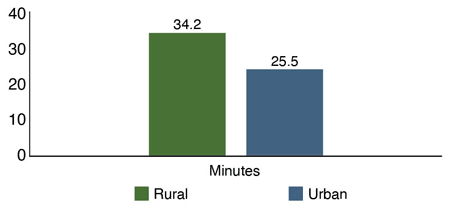
On average, U.S. residents spent 27.1 minutes traveling for care each direction.2 Rural residents spent more time in travel for care, compared to their urban counterparts (34.2 vs 25.5 minutes).2 See Figure 1. Furthermore, 47.5% of rural residents traveled more than 30 minutes, while 32.5% of urban residents traveled more than 30 minutes per one-way trip.2
Travel times varied across race/ethnicity. In rural areas, Hispanic residents averaged the most time spent in travel at 44.6 minutes, followed by Black residents at 41.4 minutes, and White residents at 33.2 minutes.2
Figure 1. Average Time Spent in Travel for Care, 20172
Distance
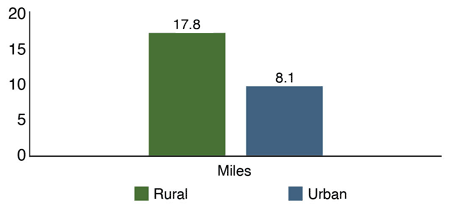
Regarding distance, the average resident traveled 9.9 miles one way to access medical/dental care.2 Rural residents traveled farther for care than urban residents (17.8 vs 8.1 miles).2 See Figure 2. Based on this data, the average rural resident traveled 120% more miles per trip for care than the average urban resident.2 Furthermore, 16.7% of rural residents traveled more than 30 miles, while only 3.7% of urban residents traveled more than 30 miles.2
Travel distances also varied across race/ethnicity. In rural areas, Hispanic residents traveled the furthest average distance at 28.3 miles, followed by Black residents at 23.5 miles, and White residents at 17.0 miles.2 Additionally, rural Hispanic residents were nearly three times more likely to travel more than 30 miles for care, compared to rural White residents.2
Figure 2. Average Distance Traveled for Care, 20172
Financial Burden
Residents with lower household incomes traveled longer times to receive medical/dental care. Households earning less than $25,000 traveled the most time (rural: 39.6 minutes, urban: 31.8 minutes).2 Households earning more than $100,000 annually traveled the least time (rural: 26.5 minutes, urban: 21.1 minutes).2
Similarly, a higher proportion of rural than urban residents identified travel as a financial burden (45% vs 37%) or agreed that the price of gasoline affects their travel (56% vs 45%).2 This statistic also differed by race/ethnicity, with 68% of Black residents identifying travel as a financial burden, compared to 53% of Hispanic residents and 49% of White residents.2
Public Transportation
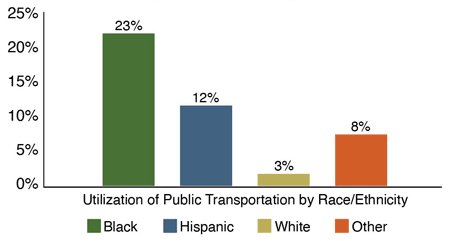
Transportation methods varied between rural and urban residents. Rural residents were shown to depend more on personal automobiles for travel, have reduced access to public transportation, and have more limited transit options compared to urban residents.2 Black residents utilized public transportation the most (23%), followed by Hispanic residents (12%), individuals identifying as ‘Other’ race (8%), and White residents (3%).2
Figure 3. Public Transportation Usage for Care by Race/Ethnicity, 20172
Travel Distances and Times for Care Among Medicare Beneficiaries
A study using 2014 Medicare administrative data on fee-for-service Medicare beneficiaries aged 65 years and older analyzed median one-way distances (miles) and times (minutes) that beneficiaries traveled for all health care visits.3 Median travel distances increased with rurality, with beneficiaries residing in urban areas traveling the shortest distance (9.2 miles), followed by those residing in large rural areas (9.6 miles), small rural areas (13.0 miles), and isolated small rural areas (22.5 miles).3 Median travel times were similar among urban areas (18 minutes), large rural areas (16 minutes), and small rural areas (19 minutes), but were significantly longer for isolated small rural areas (31 minutes).3 Notably, for beneficiaries from small rural and isolated small rural areas, over 25% of visits for ischemic heart disease and cancer required one-way trips of more than 50 miles.3
Travel distances and times were also examined across beneficiary race and ethnicity. In 2014, median travel distances (and times) in isolated small rural areas were greatest among North American Native populations at 30.7 miles (42 minutes) and shortest among Black populations at 22.3 miles (30 minutes).3
Motor Vehicle Fatalities
Motor vehicle fatalities (MVFs), combined with other unintentional injuries, are one of the top five causes of death in the U.S. and are the leading cause of death for people ages 1 - 44 years.4 Compared to all racial/ethnic groups, MVFs are highest among American Indian/Alaskan Native populations.4 Data from the 2017 County Health Rankings show that for every 100,000 people, rural counties experienced eight more deaths by MVFs than urban counties per year.4 Having a high proportion of the population between the ages of 18 and 64 correlated with more MVFs.4
Conclusions
These findings indicate the need to tailor public health interventions on commuting by geographic location. The higher burden experienced among minority groups highlights the need for interventions such as telehealth, travel discounts, and ridesharing services for medical travel. For these interventions to be successful, particularly telehealth, greater attention should be given to ensuring broadband access in rural areas.2
Resources
- The Cecil G. Sheps Center for Health Services Research (Accessed July 2022). Rural Hospital Closures landing page.
- Southwest Rural Health Research Center (2021). Rural-Urban Variations in Travel Burdens for Care: Findings from the 2017 National Household Travel Survey.
- WWAMI Rural Health Research Center (2021). Geographic Access to Health Care for Rural Medicare Beneficiaries: A National Study.
- University of Minnesota Rural Health Research Center (2018). Rural-Urban Differences in Risk Factors for Motor Vehicle Fatalities.