
Rural Communities: Age, Income, and Health Status
November 2018
by Shawnda Schroeder, PhD
Funded by the Federal Office of Rural Health Policy (FORHP), under the Health Resources and Services Administration (HRSA), the Rural Health Research Gateway strives to disseminate the work of the FORHP-funded Rural Health Research Centers (RHRCs) to diverse audiences. The RHRCs are committed to providing timely, quality research on the most pressing rural health issues. This resource provides a summary of some of their recent research.
The definition of "rural" varies by agency, program, and across states. The variability and evolution of "rural" is in response to the changing geography and culture of rural and in response to regulatory needs. In this Recap, we describe rural and urban areas exclusively though each reference may utilize a different definition of rural. Regardless of the applied definition, rural health researchers, advocates, policymakers, communities, and programs generally describe rural populations as older, sicker, and poorer than urban. Rural communities outperform urban on other measures of health, but it is important to understand disparities in age, health status, and income.
Table 1. Age, Health Status, and Income
| Population | Rural | Urban |
|---|---|---|
| Total U.S. population (2015)1 | 19.3% | 80.7% |
| Age | ||
| Median age (2015)1 | 51 | 45 |
| Life expectancy (2009)2 | 76.8 | 78.8 |
| % under age 18 (2015)1 | 22.3% | 23.5% |
| % age 65+ (2016)3 | 18.4% | 14.5% |
| % age 55+ (2016)3 | 1.8% | 2.0% |
| Health Status | ||
| Age-adjusted, all-cause mortality per 100,000 (2014)4 | 830.5 | 703.5 |
| Mortality: Suicide (2014)4 | 16.8 | 12.4 |
| Mortality: Unintentional injury4 | 54.4 | 38.3 |
| Mortality: Drug poisoning4 | 15.6 | 14.7 |
| Physically inactive (2012)4 | 27.8% | 22.3% |
| 2-3 chronic conditions (2015)5 | 22.2% | 18.2% |
| 4+ chronic conditions (2015)5 | 5.8% | 4.3% |
| High cholesterol (2013)5 | 42.4% | 38.8% |
| Hypertension (2013)5 | 38.1% | 32.6% |
| Arthritis (2013)5 | 31.1% | 25.1% |
| Diabetes (2013)5 | 12.0% | 10.4% |
| Heart disease (2013)5 | 8.6% | 6.5% |
| COPD (2013)5 | 8.7% | 6.3% |
| Income | ||
| Median household income (2016)6 | $46,000 | $62,000 |
| Poverty rate (2016)7 | 16.9% | 13.6% |
| Food insecure (2013)4 | 15.8% | 14.5% |
Age
Using the Census division definition, rural residents report an older median age (51) than their urban counterparts (45).1 Rural communities also have a larger proportion of residents ages 65 and older (18.4% compared to 14.5%) than do urban, and report a slightly smaller proportion of children.3 However, the oldest old (85+) make up more of urban areas (2%) than they do rural (1.8%).3
Health Status
Overall, rural residents have a shorter life expectancy than urban residents.2 Some variables that may influence life expectancy include increased rates of chronic disease and physical inactivity among rural residents.4-5 Compared to urban residents, a greater proportion of rural residents report having 2-3 and 4 or more chronic conditions.5
Rural (nonmetro) residents report a higher age-adjusted mortality rate per 100,000 population for all causes (830.5 for rural and 703.5 for urban).4 Rural communities also have higher mortality rates than urban (metro) for suicide (16.8 compared to 12.4), unintentional injury (54.4 compared to 38.3), and drug poisoning (15.6 compared to 14.7).4 Similarly, diabetes mortality is consistently higher in increasingly rural areas of the U.S. For example, in 2015 residents in noncore communities (the most rural classification) had a 12.4-point higher mortality rate from diabetes than those living in large central metro areas.8 The gap between rural and urban mortality rates continues to increase. During 1990-1992, there was a 2% difference in mortality rate between rural and urban counties. By 2005-2009, rural counties had a 13% higher mortality rate than urban counties.9
Across various age groups, fewer rural residents were found to utilize preventative health services. For example, among Medicaid enrollees ages 85 and older, rural beneficiaries reported lower annual medical and dental visit rates and higher rates of outpatient visits and prescription medication use.3 Among pediatric patients, those in rural communities reported fewer preventive dental visits and worse oral health.10
Although the research centers report clear disparities in health behaviors and health status between rural and urban residents, among the “oldest-old” (ages 85 and older), household income, health status, cognitive impairment, and rates of chronic conditions do not differ.3
Income
Rural households report a lower median income than urban and have a greater proportion of the population reporting food insecurity.1,4 In 2010, rural adults were more likely than those in urban areas to begin the year with incomes below 138% of the federal poverty level, particularly in states that did not expand Medicaid.11 Similarly, the 2016 poverty rate was higher in rural (nonmetro) communities than in urban (metro) with greater disparities in the South and West.7 See Figure 1.
Figure 1. Rural-Urban Poverty Rates by Region7
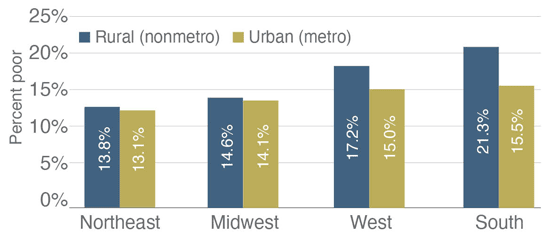
Source: USDA, Economic Research Service using U.S. Census Bureau, American Community Survey 5-year average county-level data for 2012-16 and 2013 Office of Management and Budget nonmetro/metro county designations.
Although rural communities have a smaller proportion of residents under the age of 18 than do urban, rural areas have a higher percentage of children living in poverty.7 This proportion of children living in poverty or low income families has increased across the decade.7,10
Because of lower incomes, older populations, higher poverty rates, and less access to employer-sponsored insurance, rural people are less likely than their urban counterparts to have health insurance.12 In 2014, prior to implementation of the Patient Protection and Affordable Care Act, rural people were more likely to be covered by Medicaid (21%) or other public insurance (4%) than were urban (16% and 3%, respectively).12 This pattern continued into 2015 and 2016.12 Among Medicare beneficiaries ages 85 and older, rural residents were more likely than urban to be covered by both Medicare and Medicaid (dual eligible) (28.3% compared to 22.4%).3 Rural residents have also been found to forgo medical care due to cost more often than urban residents.13
Conclusions
As studies discuss the implications of income or age on health-seeking behavior, health status, access, or utilization of care, it is imperative to recognize what this means for our older and lower-income rural communities. However, not all rural communities are the same. Researchers report variability within rural among gender, race, ethnicity, and census regions as well. These trends are explored in their respective policy briefs.
Resources
- U.S. Census Bureau, 2011-2015. Measuring America.
- Singh, G.K., Siahpush, M. (2014). Widening Rural-Urban Disparities in Life Expectancy, U.S., 1969-2009. AJPM, 46(2)
- Maine Rural Health Research Center (2018). Residential Settings and Healthcare Use of the Rural "Oldest-Old" Medicare Population.
- North Carolina Rural Health Research and Policy Analysis Center (2017). Rural Health Snapshot (2017).
- Rural Health Information Hub (RHIhub) (2018). Chronic Disease in Rural America.
- U.S. Census Bureau, 2009-2016. Small Area Income and Poverty Estimates.
- United States Department of Agriculture. (2018). Rural Poverty & Well-Being.
- Southwest Rural Health Research Center (2017). Diabetes Mortality in Rural America: 1999-2015.
- North Carolina Rural Health Research and Policy Analysis Center (2017). Regional Differences in Rural and Urban Mortality Trends.
- Rural and Minority Health Research Center (2017). Chartbook: Trends in Rural Children's Oral Health and Access to Care.
- Maine Rural Health Research Center (2018). Medicaid Income Eligibility Transitions Among Rural Adults.
- RUPRI Health Panel (2018). Insuring Rural America: Health Insurance Challenges and Opportunities.
- Southwest Rural Health Research Center (2017). Diabetes and Forgone Medical Care Due to Cost in the U.S. (2011-2015).