
Rural Ethnic/Racial Disparities: Adverse Health Outcomes
November 2020
by Per Ostmo, MPA
Funded by the Federal Office of Rural Health Policy (FORHP), under the Health Resources and Services Administration (HRSA), the Rural Health Research Gateway disseminates work of the FORHP-funded Rural Health Research Centers (RHRCs) to diverse audiences. The RHRCs are committed to providing timely, quality research on the most pressing rural health issues. This resource provides a summary of some of their recent research on racial and ethnic inequities.
There were 10 million rural residents who identified as Black, Hispanic, American Indian/Alaska Native (AI/AN), Asian American/Pacific Islander (AA/PI), or mixed race in 2017.1 Currently, 1 in 5 rural residents belongs to one of these groups.1 Compared to the non-Hispanic White (hereafter, White) rural population, these minority groups experience several disadvantageous social determinants of health.2-5
Rural Populations Age Breakdown in 2016
The age breakdown of rural ethnicities varies across groups, but all rural minority groups trend younger than their rural White counterparts. See Figure 1. Minority populations tend to contain proportionately more children than White populations in the U.S.4 Additionally, urban communities tend to contain more children than rural communities.4
Figure 1. Age Breakdown of Rural Populations in 20162-5
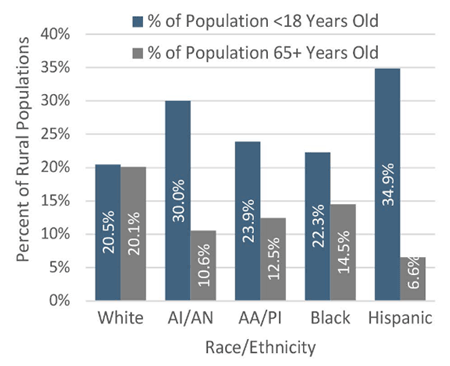
Rural Hispanic residents were the youngest minority group by a considerable margin with a median age of 28.4 years, which was approximately 15 years younger than their White counterparts.5 Nearly three-quarters of the Hispanic population, in both rural and urban areas, were age 44 or younger while less than 7% were aged 65 or older.5
Higher rates of premature death, higher birth rates, and older minority residents returning to their country of origin are possible explanations for minority populations trending younger than White populations.
Premature Death in 2017
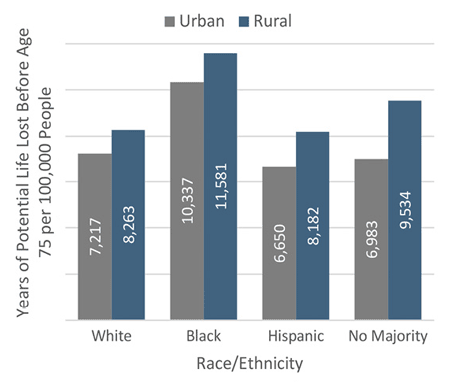
Rates of premature death (defined as years of potential life lost before age 75, per 100,000 people) are greater among rural residents than their urban counterparts, and are even greater for people of color than White residents.1 Regardless of rural/urban location, counties with a majority of AI/AN residents had the highest rate of premature death (16,255 years of potential life lost before age 75, per 100,000 people) followed by majority Black counties (11,211 years lost).1 Both are significantly higher than the rate for majority White counties (7,872 years lost) and majority Hispanic counties (7,693 years lost).1 The difference in premature death between rural and urban counties was most pronounced for counties with no majority racial and ethnic group (difference of 2,551 years lost).1 Because zero counties have a majority AA/PI population, no data are included.
Figure 2. Premature Death Rate within Racial/Ethnic Composition by Rural-Urban Majority Group1
Age-Adjusted Mortality per 100,000 Residents in 2016
Age-adjusted mortality rates are generally higher in rural counties and declines in mortality over time have been faster in urban than rural counties.3
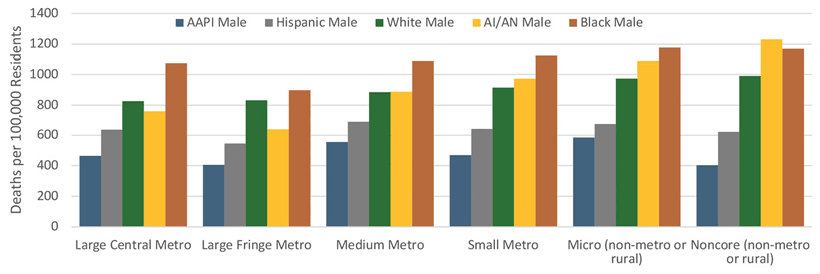
The leading causes of death for the AI/AN population include tobacco use, heart disease, and accidents.2 The highest rate of age-adjusted mortality for the AI/AN population was for men living in noncore rural counties at 1,232 deaths per 100,000; 24% higher than their White counterparts.2 AI/AN women in rural counties had a death rate 16% higher than their White peers.2 The lowest rates of age-adjusted mortality were in large fringe metropolitan counties for both AI/AN men (639 deaths per 100,000) and women (466 deaths per 100,000).2
At the national level, cancers, heart disease, and cerebrovascular disease are the leading causes of death for AA/PI residents.3 AA/PI populations had lower age-adjusted death rates than their White counterparts across all levels of rurality.3 Possible explanations of favorable mortality rates include advantages in income and education, the "healthy immigrant" effect, or older residents returning to their home countries.3
The highest mortality rate for Black residents was found in men living in micropolitan counties (1,177 deaths per 100,000), followed closely by men living in noncore rural counties (1,171 deaths per 100,000).4 Death rates for all Black residents exceed those of their White peers, and rural death rates exceed their urban counterparts.4
Hispanic populations at all levels of rurality have a lower death rate than their White peers, despite a lower socioeconomic status, lower health insurance rates, and lack of access to health care.5 This phenomenon is referred to as the "Hispanic paradox." Additionally, the rural disadvantages that are present in other ethnicities are absent in the Hispanic population. One possible explanation of the "Hispanic paradox" is selective migration of healthy individuals to the U.S. and reverse migration of older adults.5
Figure 3. Rural-Urban Age-Adjusted Mortality Rates per 100,000 Residents for Females of all Racial/Ethnic Groups2-5
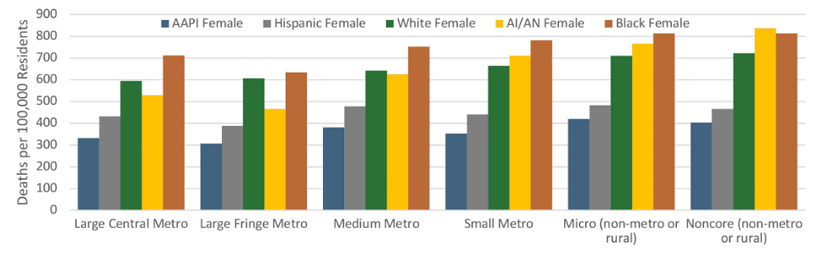
Figure 4. Rural-Urban Age-Adjusted Mortality Rates per 100,000 Residents for Males of all Racial/Ethnic Groups2
Self-Reported Health in 2015
Rural residents generally are more likely to report their health as poor and more likely to engage in high-risk health behaviors.4 In rural counties with a high proportion (>20%) of AI/AN, Black, or Hispanic populations, residents were more likely to report poor or fair health than rural counties with proportionately fewer AI/AN, Black, or Hispanic populations.2,4,5 AA/PI populations were the only minority group to self-report better health than White populations.3
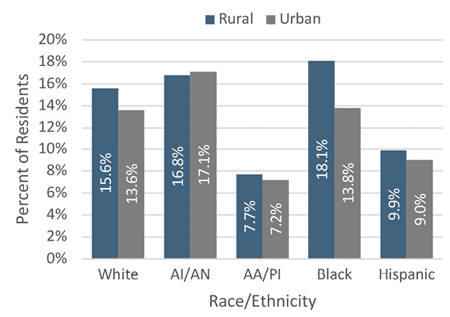
Disability Status in 2016
Disability rates were comparable across rural and urban settings for AI/AN, AA/PI, and Hispanic populations.2,3,5 See Figure 5. Across minority groups, AA/PI and Hispanic residents have significantly lower rates of disability.3,5 Possible explanations include a self-selection of healthy individuals immigrating to the U.S., a lower median age, and healthier behaviors.3,5
Figure 5. Rural-Urban Disability Status of Residents in 20162-5
Behavioral Consequences in 2015
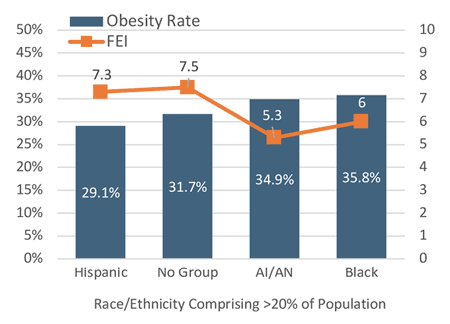
A potential contributor to the obesity problem in rural areas is the food environment of rural communities. The Food Environment Index (FEI) accounts for income and geographic proximity to food, as well as food security, measured by consistent access to food.2-5 It is measured on a scale of 0-10 where 10 is the best possible situation.2-5 While obesity may be one determinant of the mortality rate, the FEI may be one determinant of obesity. The lower than average FEI scores in high concentration AI/AN and Black counties correlate with higher than average rates of obesity in those counties.2,4 See Figure 6. In counties where more than 20% of the population was comprised of AI/AN residents, obesity rates were high (34.9%) while the FEI was low (5.3).2 No reliable data for obesity rates and FEI are available for high concentration AA/PI counties, but overall rural adult obesity rates for AA/PI populations are lower than average at 15.5%.3
Figure 6. Obesity Rates and the Food Environment Index2,4,5
Conclusion
Rural communities have higher morbidity and mortality rates than urban communities, due to structural and individual risk factors that include higher rates of poverty and environmental risks, more limited access to medical care, and poorer health behaviors such as lower seat belt use, higher smoking and alcohol use, and lower physical activity.1
Rural AI/AN and Black populations have significantly higher rates of premature death, age-adjusted mortality, and obesity than their rural White counterparts.1,2,4 Rural AA/PI residents have, on average, higher income and educational attainment and better health outcomes than rural White residents.3 Conversely, the "Hispanic paradox" of positive health outcomes for that disadvantaged population is surprising and lacks definitive explanation.5 This recap is part two of two in a series on Rural Ethnic/Racial Disparities. Read Rural Ethnic/Racial Disparities: Social and Systemic Inequities for more information.6
Resources
- University of Minnesota Rural Health Research Center (2019). Dying Too Soon: County-level Disparities in Premature Death by Rurality, Race, and Ethnicity.
- Rural and Minority Health Research Center (2019). Social Determinants of Health Among Rural American Indian and Alaska Native Populations.
- Rural and Minority Health Research Center (2019). Social Determinants of Health Among Rural Asian and Pacific Islander Populations.
- Rural and Minority Health Research Center (2019). Social Determinants of Health Among Rural African American Population.
- Rural and Minority Health Research Center (2019). Social Determinants of Health Among Rural Hispanic Population.
- Ostmo, P. (2020). Rural Ethnic/Racial Disparities: Social and Systemic Inequities.