
Rural Ethnic/Racial Disparities: Social and Systemic Inequities
November 2020
by Per Ostmo, MPA
Funded by the Federal Office of Rural Health Policy (FORHP), under the Health Resources and Services Administration (HRSA), the Rural Health Research Gateway disseminates work of the FORHP-funded Rural Health Research Centers (RHRCs) to diverse audiences. The RHRCs are committed to providing timely, quality research on the most pressing rural health issues. This resource provides a summary of some of their recent research on racial and ethnic inequities.
There were 10 million rural residents who identified as Black, Hispanic, American Indian/Alaska Native (AI/AN), Asian American/Pacific Islander (AA/PI), or mixed race in 2017.1 Currently, 1 in 5 rural residents belongs to one of these groups.1 Compared to the non-Hispanic White (hereafter, White) rural population, these minority groups experience several disadvantageous social determinants of health.2-5
Minority Group Populations in 2016
America's 2.7 million AI/AN residents are comprised of more than 550 different tribes.2 Of these residents, 46.1% lived in rural areas, accounting for 1.7% of the rural population.2 Long-term social disadvantages facing those who are AI/AN including colonization, forced migration, land loss, and cultural devastation continue today.2
America's 600,000 rural AA/PI residents made up about 1% of the rural population.3 Like other immigrant populations, AA/PI residents face challenges and stress from limited English fluency, acculturation, and discrimination.3 More than 60% of AA/PI residents report being born outside of the United States.3 The AA/PI population is highly diverse, including heritages from over 50 different countries with distinct cultures and languages.3
Black residents were the third largest racial group in the U.S., making up 6% of the total rural population.4 However, residents who are Black account for 11.5% of the southern rural population.4 Individuals who are Black and live in rural areas also disproportionately live in economically challenged communities.4
At 58 million individuals, Hispanic residents are the largest non-White population in the country, accounting for 17.8% of the total population and 6.5% of the rural population.5 Fewer rural (26.7%) than urban (34.8%) Hispanic residents reported being born outside of the U.S.5 Hispanic residents are projected to become the largest rural minority in the U.S. by 2025.5
Individuals belonging to racial and ethnic minority groups encounter several social and systemic inequities which impact access to and utilization of health care as well as overall health status. A few of the disparities include:
- Access to equitable education
- Income and poverty levels
- Insurance status
- Broadband access
- Preventive care access and utilization
- Veteran status
High School Education in 2016
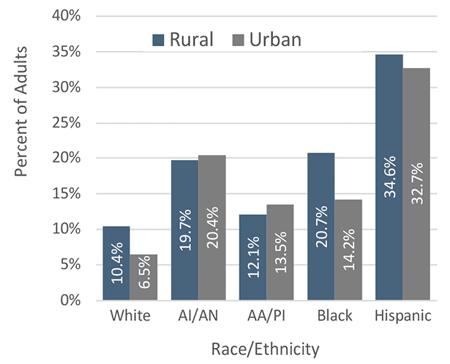
Comparing the four rural minority groups with the rural White population for high school completion rates highlights large adverse disparities for the AI/AN, Black, and Hispanic populations. See Figure 1.
Figure 1. Rural-Urban Adults (25+) with Less than a High School Education2-5
Poverty in 2016
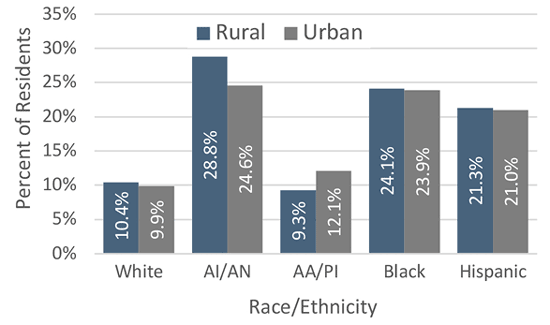
Rural/urban differences in the percentage of residents living below the federal poverty line were negligible for White, Black, and Hispanic populations, with marginal differences in AA/PI populations and significant differences in AI/AN populations. See Figure 2.
Figure 2. Rural-Urban Residents Living Below the Federal Poverty Line2-5
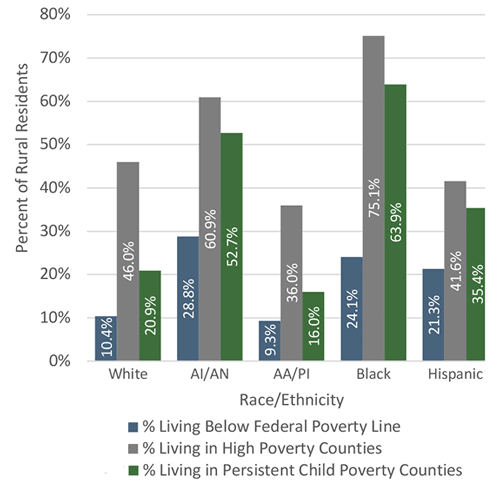
Among rural minority groups, AI/AN had the highest proportion of residents living below the federal poverty line (28.8%).2-5 The rural Black population had both the highest proportion of residents living in high poverty counties (75.1%) and the highest proportion of residents living in persistent child poverty counties (63.9%). See Figure 3. In 2015, of the 100 U.S. counties with the highest childhood poverty rates, 95 were rural counties, and 66 were counties in which White residents were in the minority.6
Figure 3. Poverty of Rural Residents in 20162-5
Rates of Uninsured in 2015
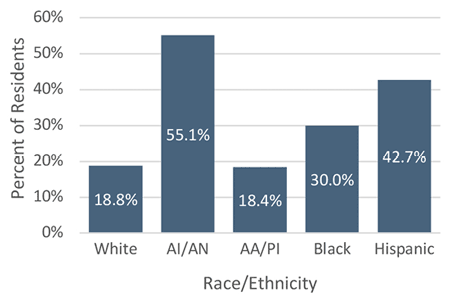
Rural health care facilities that lack a paying patient base have difficulty remaining in operation. The lack of accessible care for rural residents leads to undesirable health outcomes. Rural AA/PI fared the best with only 18.4% of residents living in counties falling into the highest quartile for the proportion of the population lacking health insurance, while rural AI/AN fared the worst at 55.1%.2,3 See Figure 4.
Figure 4. Rural Residents Living in Counties Falling into the Top Quartile for the Proportion of the Population Lacking Health Insurance2-5
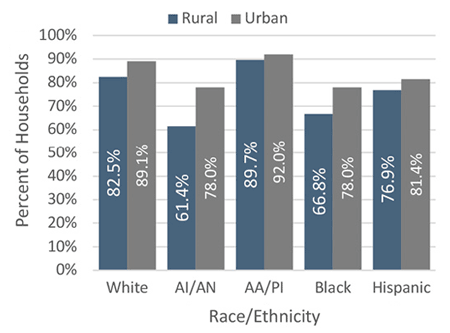
Broadband Access in 2016
Telehealth is a promising solution for increased access to health care in rural counties. However, telehealth is limited by the availability of broadband internet. Income and education level of the household are the major predictors of broadband access.2-5 Accordingly, rural AA/PI households had the highest rate of broadband access (89.7%), while rural AI/AN households had the lowest rate (61.4%).2-5 See Figure 5. Rates of broadband access are higher in urban counties than rural counties for all racial/ethnic groups.2-5
Figure 5. Rural-Urban Households Reported Having Broadband Internet Service2-5
Preventive Care in 2017: Vaccinations and Cancer Screening
Of all rural racial/ethnic groups, AI/AN residents were the most likely to have received a flu vaccination in the past year (50.4%) while Hispanic residents were least likely (30.4%).7 Rural White residents were the most likely to have ever received a pneumonia vaccine (27.3%) while rural Hispanic residents were least likely (13.5%).7
Five types of cancer screenings were assessed: breast exam, colorectal exam, mammogram, Pap smear, and prostate-specific antigen (PSA) blood test.7 Rural White residents were most likely to have been screened for cancer while rural Hispanics were least likely.7
Veteran Status in 2016
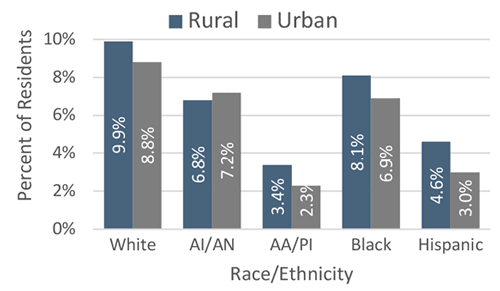
In general, rural residents were more likely to be veterans of the U.S. Armed Forces than urban residents (9.4% versus 7.0%).4 Rural veterans may experience barriers to health services due to travel distances and lack of awareness of their availability.4
Historically, AI/AN populations have served in the U.S. Armed Forces at disproportionately high levels.2 An estimated 12.6% of the total AI/AN population served during World War II.2 In 2016, the proportion of veterans among the AI/AN rural population (6.8%) was lower than among White residents (9.9%).2 This could be partially explained by shorter lifespans of AI/AN populations compared to White populations.2
Figure 6. Rural-Urban Veteran Status of Residents as Reported by the Census Bureau in 20162-5
Conclusion
Of the four rural minority groups, AA/PI residents suffer from health disparities markedly less than rural Hispanic, Black, and AI/AN residents, often faring marginally better than their rural White counterparts.2-5 Poverty rates for rural AI/AN, Black, and Hispanic populations are particularly disparate with an alarmingly high percentage of rural Black residents living in persistent child poverty counties.2-5 When comparing rural-urban disparities in health, rural residents tend to fare worse on most measures, including mortality, health status, access to care, and use of preventive services.7 This recap is part one of two in a series on Rural Ethnic/Racial Disparities. Read Rural Ethnic/Racial Disparities: Adverse Health Outcomes for more information.8
Resources
- University of Minnesota Rural Health Research Center (2019). Dying Too Soon: County-level Disparities in Premature Death by Rurality, Race, and Ethnicity.
- Rural and Minority Health Research Center (2019). Social Determinants of Health Among Rural American Indian and Alaska Native Populations.
- Rural and Minority Health Research Center (2019). Social Determinants of Health Among Rural Asian and Pacific Islander Populations.
- Rural and Minority Health Research Center (2019). Social Determinants of Health Among Rural African American Population.
- Rural and Minority Health Research Center (2019). Social Determinants of Health Among Rural Hispanic Population.
- Rural and Minority Health Research Center (2016). Current State of Child Health in Rural America: How Context Shapes Children's Health.
- University of Minnesota Rural Health Research Center (2019). Differences in Preventive Care Among Rural Residents by Race and Ethnicity.
- Ostmo, P. (2020). Rural Ethnic/Racial Disparities: Adverse Health Outcomes.